调试利器pprof使用中
Salted Fish 1991/6/26 包使用
# 1. 调用图说明
# 1.1 示例图
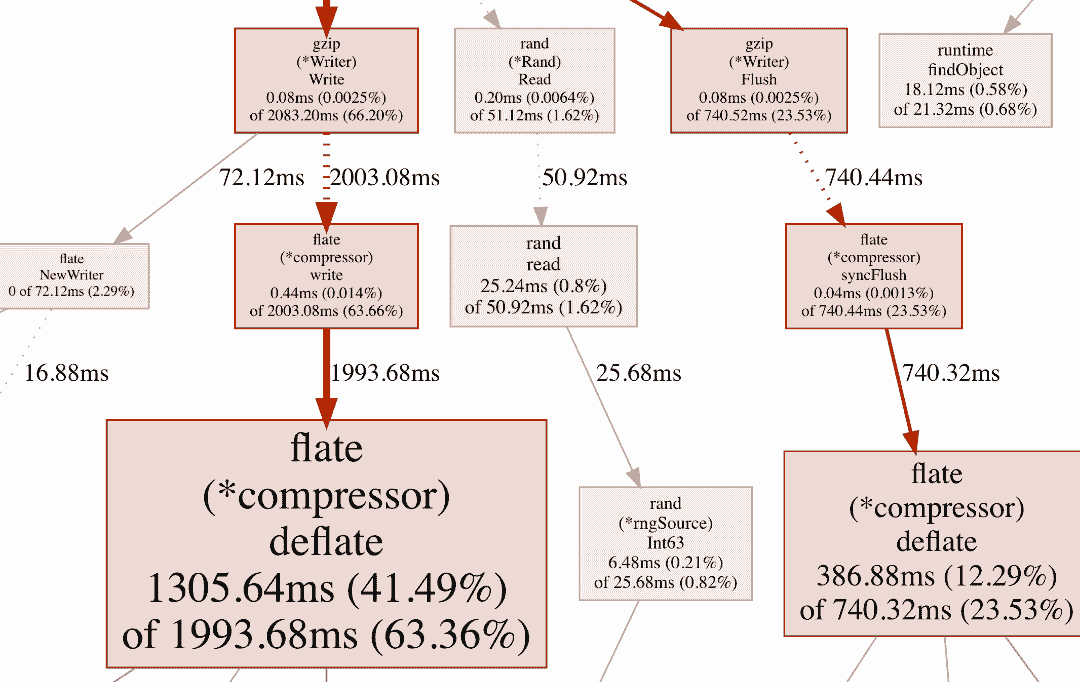
# 1.2 节点颜色
- 红色代表累计值cum为正,并且很大;
- 绿色代表累计值cum为负,并且很大;
- 灰色代表累计值cum可以忽略不计。
# 1.3 节点字体大小
- 较大的字体表示较大的当前值;
- 较小的字体表示较小的当前值。
# 1.4 边框颜色
- 当前值较大并且为正数时为红色;
- 当前值较小并且为负数时为绿色;
- 接近0的当前值为灰色。
# 1.5 箭头大小
- 箭头越粗代表当前的路径消耗了越多的资源;
- 箭头越细代表当前的路径消耗了越少的资源。
# 1.6 箭头类型
- 虚线箭头表示两个节点之间的某些节点已被忽略,为间接调用;
- 实线箭头表示两个节点之间为直接调用。
# 2. 火焰图说明
# 2.1 示例图
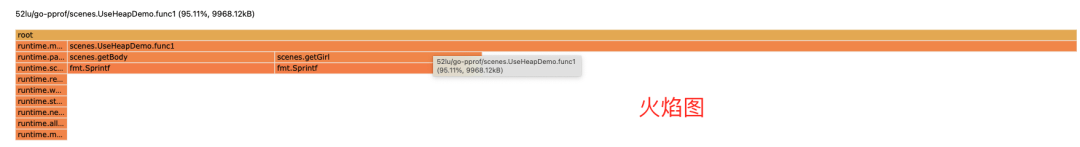
# 2.2 含义说明
- 最上方的
root框代表整个程序的开始,其他的框都代表一个函数。 - 火焰图每一层中的函数都是平级的,下层函数是其对应的上层函数的子函数。
- 函数调用栈越长,火焰就越高。
- 框越长、颜色越深,代表当前函数占用资源越多。
- 可以单击任何框,查看该函数更详细的信息。
排查三步曲:
top: 根据资源排序;list:查看具体代码信息;web:在浏览器中打开调用图
# 3. 排查内存占用高
# 3.1 进入交互式
# 这里的app是编译后的文件名
➜ go tool pprof app http://127.0.0.1:6060/debug/pprof/heap
Fetching profile over HTTP from http://127.0.0.1:6060/debug/pprof/heap
Saved profile in /Users/liuqh/pprof/pprof.app.alloc_objects.alloc_space.inuse_objects.inuse_space.001.pb.gz
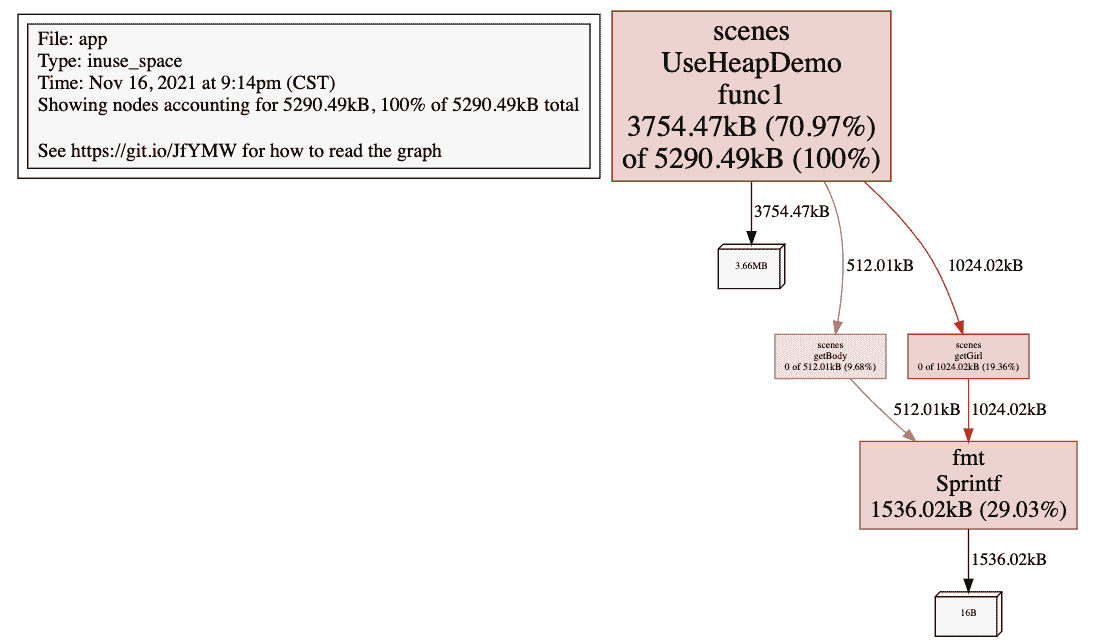
File: app
Type: inuse_space
Time: Nov 16, 2021 at 9:14pm (CST)
Entering interactive mode (type "help" for commands, "o" for options)
1
2
3
4
5
6
7
8
2
3
4
5
6
7
8
# 3.2 定位内存最高
(pprof) top
Showing nodes accounting for 5290.49kB, 100% of 5290.49kB total
      flat  flat%   sum%        cum   cum%
 3754.47kB 70.97% 70.97%  5290.49kB   100%  52lu/go-pprof/scenes.UseHeapDemo.func1
 1536.02kB 29.03%   100%  1536.02kB 29.03%  fmt.Sprintf
         0     0%   100%   512.01kB  9.68%  52lu/go-pprof/scenes.getBody
         0     0%   100%  1024.02kB 19.36%  52lu/go-pprof/scenes.getGirl
1
2
3
4
5
6
7
2
3
4
5
6
7
# 3.3 查看具体代码
(pprof) list UseHeapDemo
Total: 5.17MB
ROUTINE ======================== 52lu/go-pprof/scenes.UseHeapDemo.func1 in /Users/liuqh/ProjectItem/GoItem/go-pprof/scenes/heap.go
    3.67MB     5.17MB (flat, cum)   100% of Total
         .          .      8:func UseHeapDemo()  {
         .          .      9: go func() {
         .          .     10:  var result []string
         .          .     11:  i := 1
         .          .     12:  for {
         .   512.01kB     13:   body := getBody()
         .        1MB     14:   girl := getGirl()
         .          .     15:   result = append(result,body...)
    3.67MB     3.67MB     16:   result = append(result,girl...)
         .          .     17:   fmt.Printf("第%d轮,count:%v \n",i,len(result))
         .          .     18:   time.Sleep(time.Second * 5)
         .          .     19:   i++
         .          .     20:  }
         .          .     21: }()
(pprof)
1
2
3
4
5
6
7
8
9
10
11
12
13
14
15
16
17
18
19
2
3
4
5
6
7
8
9
10
11
12
13
14
15
16
17
18
19
# 3.4 在浏览器中查看
(pprof) web
1
# 4. 排查CPU占用高
# 4.1 进入交互式
# 这里的app是编译后的文件名
➜ go tool pprof app http://127.0.0.1:6060/debug/pprof/profile
Fetching profile over HTTP from http://127.0.0.1:6060/debug/pprof/profile
Saved profile in /Users/liuqh/pprof/pprof.app.samples.cpu.003.pb.gz
File: app
Type: cpu
Time: Nov 16, 2021 at 8:55pm (CST)
Duration: 30s, Total samples = 15.76s (52.53%)
Entering interactive mode (type "help" for commands, "o" for options)
(pprof)
1
2
3
4
5
6
7
8
9
10
2
3
4
5
6
7
8
9
10
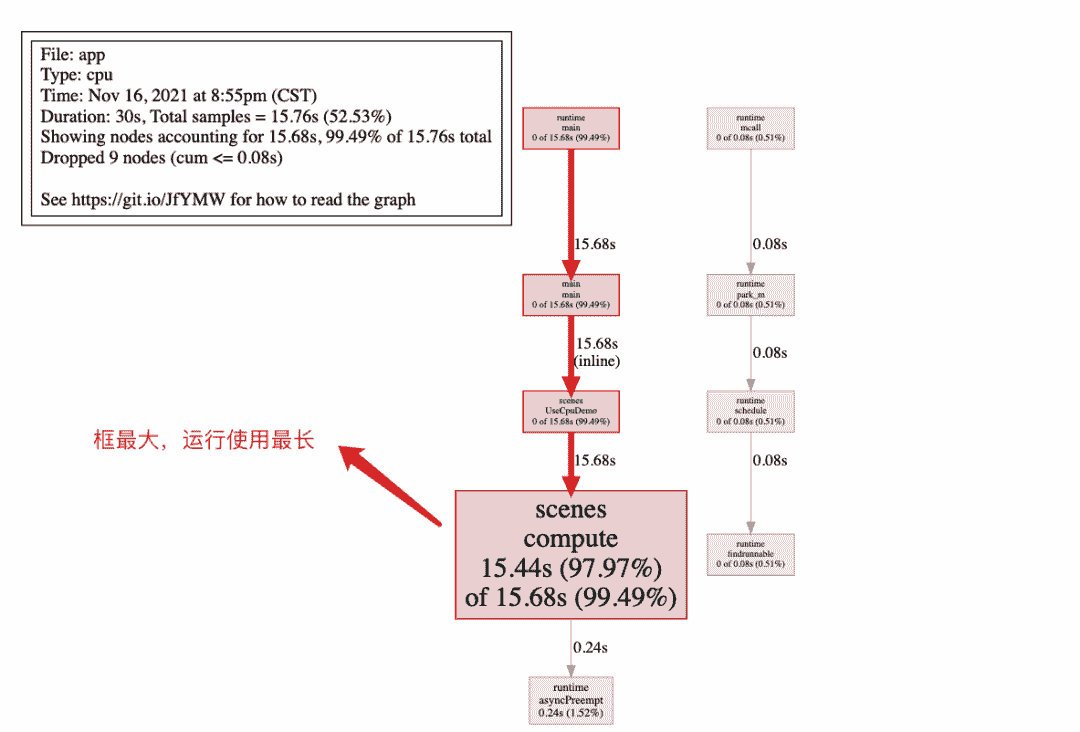
# 4.2 定位cpu占用最高
(pprof) top
Showing nodes accounting for 15.68s, 99.49% of 15.76s total
Dropped 9 nodes (cum <= 0.08s)
flat  flat%   sum%        cum   cum%
15.44s 97.97% 97.97%     15.68s 99.49%  52lu/go-pprof/scenes.compute
0.24s  1.52% 99.49%      0.24s  1.52%  runtime.asyncPreempt
0     0% 99.49%     15.68s 99.49%  52lu/go-pprof/scenes.UseCpuDemo (inline)
0     0% 99.49%     15.68s 99.49%  main.main
0     0% 99.49%      0.08s  0.51%  runtime.findrunnable
0     0% 99.49%     15.68s 99.49%  runtime.main
0     0% 99.49%      0.08s  0.51%  runtime.mcall
0     0% 99.49%      0.08s  0.51%  runtime.park_m
0     0% 99.49%      0.08s  0.51%  runtime.schedule
1
2
3
4
5
6
7
8
9
10
11
12
13
2
3
4
5
6
7
8
9
10
11
12
13
# 4.3 查看具体代码
(pprof) list compute
Total: 15.76s
ROUTINE ======================== 52lu/go-pprof/scenes.compute in /Users/liuqh/ProjectItem/GoItem/go-pprof/scenes/cpu.go
    15.44s     15.68s (flat, cum) 99.49% of Total
         .          .      6: compute()
         .          .      7:}
         .          .      8:
         .          .      9:func compute()  {
         .          .     10: var total int64
    15.44s     15.68s     11: for i := 0; i < 100000000000; i++ {
         .          .     12:  total = total + int64(i)
         .          .     13: }
         .          .     14: fmt.Println("遍历完成")
         .          .     15:}
1
2
3
4
5
6
7
8
9
10
11
12
13
14
2
3
4
5
6
7
8
9
10
11
12
13
14
# 4.4 在浏览器中查看
(pprof) web
1
@注:需要安装graphviz
# 5. 排查协程泄露
分析协程栈有两方面的作用,一是查看协程的数量,查看协程是否泄漏。二是查看当前大量的协程在执行哪些函数,判断当前协程是否健康。
# 5.1 什么是协程泄露
Go的并发是以goroutine和channel的形式实现的。协程泄露是指goroutine创建后,长时间得不到释放,并且还在不断地创建新的goroutine协程,最终导致内存耗尽,程序崩溃。
# 5.2 进入交互式
➜ go tool pprof app http://127.0.0.1:6060/debug/pprof/goroutine
Fetching profile over HTTP from http://127.0.0.1:6060/debug/pprof/goroutine
Saved profile in /Users/liuqh/pprof/pprof.app.goroutine.007.pb.gz
File: app
Type: goroutine
Time: Nov 16, 2021 at 9:43pm (CST)
Entering interactive mode (type "help" for commands, "o" for options)
1
2
3
4
5
6
7
2
3
4
5
6
7
# 5.3 定位协程情况
(pprof) top
Showing nodes accounting for 37, 100% of 37 total # 收集到37个协程
Showing top 10 nodes out of 41
      flat  flat%   sum%        cum   cum%
        35 94.59% 94.59%         35 94.59%  runtime.gopark
         1  2.70% 97.30%          1  2.70%  net/http.(*connReader).backgroundRead
         1  2.70%   100%          1  2.70%  runtime/pprof.runtime_goroutineProfileWithLabels
         0     0%   100%          1  2.70%  52lu/go-pprof/scenes.UseGoroutineDemo
         0     0%   100%          1  2.70%  52lu/go-pprof/scenes.errorUse
         0     0%   100%         30 81.08%  52lu/go-pprof/scenes.errorUse.func1
         0     0%   100%          3  8.11%  bufio.(*Reader).ReadLine
         0     0%   100%          3  8.11%  bufio.(*Reader).ReadSlice
         0     0%   100%          3  8.11%  bufio.(*Reader).fill
         0     0%   100%          1  2.70%  internal/poll.(*FD).Accep
1
2
3
4
5
6
7
8
9
10
11
12
13
14
2
3
4
5
6
7
8
9
10
11
12
13
14
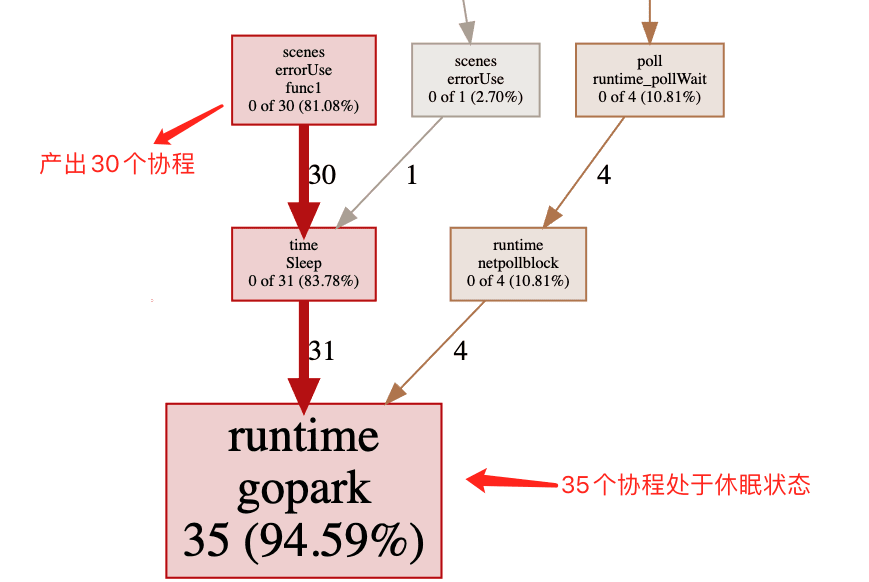
分析:
从上面看到有35个协程都在runtime.gopark函数,runtime.gopark:代表协程处于休眠状态,其中有30个协程是由scenes.errorUse.func1产出。
# 5.4 查看具体代码
(pprof) list errorUse.func1
Total: 37
ROUTINE ======================== 52lu/go-pprof/scenes.errorUse.func1 in /Users/liuqh/ProjectItem/GoItem/go-pprof/scenes/goroutine.go
         0         30 (flat, cum) 81.08% of Total
         .          .      9:
         .          .     10:func errorUse()  {
         .          .     11: for  {
         .          .     12:  time.Sleep(time.Second)
         .          .     13:  go func() {
         .         30     14:   time.Sleep(time.Second * 30)
         .          .     15:  }()
         .          .     16: }
         .          .     17:}
         .          .     18:func trueUse()  {
         .          .     19: res := make(chan []int)
1
2
3
4
5
6
7
8
9
10
11
12
13
14
15
2
3
4
5
6
7
8
9
10
11
12
13
14
15
# 5.5 在浏览器中查看
(pprof) web
1
# 5.6 base基准分析
除了上面的分析方法,pprof还提供了更强大的工具用于对比前后特征文件的不同。下例使用了-base标志,后跟基准特征文件。
# 使用基准值
➜  go tool pprof -base pprof.app.goroutine.001.pb.gz pprof.app.goroutine.002.pb.gz
File: app
Type: goroutine
Time: Nov 16, 2021 at 10:12pm (CST)
Entering interactive mode (type "help" for commands, "o" for options)
(pprof) top
Showing nodes accounting for 28, 100% of 28 total
      flat  flat%   sum%        cum   cum%
        28   100%   100%         28   100%  runtime.gopark
         0     0%   100%         28   100%  52lu/go-pprof/scenes.errorUse.func1
         0     0%   100%         28   100%  time.Sleep
(pprof)➜  pprof go tool pprof -base pprof.app.goroutine.001.pb.gz pprof.app.goroutine.002.pb.gz
File: app
Type: goroutine
Time: Nov 16, 2021 at 10:12pm (CST)
Entering interactive mode (type "help" for commands, "o" for options)
(pprof) top
Showing nodes accounting for 28, 100% of 28 total
      flat  flat%   sum%        cum   cum%
        28   100%   100%         28   100%  runtime.gopark
         0     0%   100%         28   100%  52lu/go-pprof/scenes.errorUse.func1
         0     0%   100%         28   100%  time.Sleep
1
2
3
4
5
6
7
8
9
10
11
12
13
14
15
16
17
18
19
20
21
22
23
2
3
4
5
6
7
8
9
10
11
12
13
14
15
16
17
18
19
20
21
22
23
从上面可以看出,后一个基准特征文件比前一个基准特征文件多了28个协程,其中28个协程都处于执行runtime.gopark阶段,从而可以判断协程是否已经泄漏。
# 6. 排查锁竞争情况
mutex主要用于查看锁争用导致的休眠时间,这有助于排查由于锁争用导致CPU利用率不足的问题,**需要注意的是:默认不开启锁的竞争分析,需要调用runtime.SetMutexProfileFraction进行设置。**开启方式如下:
func init() {
 // 开启http端口,用协程的方式监听,否则会阻塞
 go func() {
  if err := http.ListenAndServe(":6060", nil); err != nil {
   fmt.Println("pprof err:",err)
  }
 }()
  // 开启锁争用分析
 // 默认不开启锁的竞争分析,需要调用runtime.SetMutexProfileFraction进行设置。
 runtime.SetMutexProfileFraction(1)
}
1
2
3
4
5
6
7
8
9
10
11
2
3
4
5
6
7
8
9
10
11
# 6.1 进入交互式
➜ go tool pprof http://127.0.0.1:6060/debug/pprof/mutex
Fetching profile over HTTP from http://127.0.0.1:6060/debug/pprof/mutex
Saved profile in /Users/liuqh/pprof/pprof.contentions.delay.007.pb.gz
Type: delay
Time: Nov 17, 2021 at 3:04pm (CST)
Entering interactive mode (type "help" for commands, "o" for options)
1
2
3
4
5
6
2
3
4
5
6
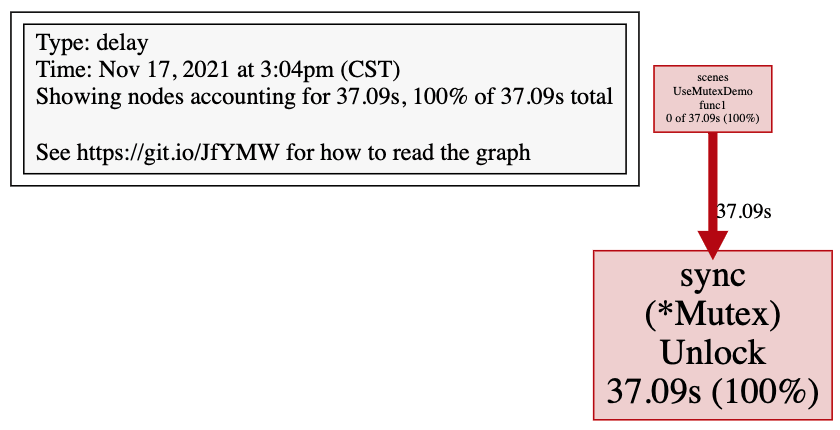
# 6.2 排序互斥耗时
(pprof) top
Showing nodes accounting for 37.09s, 100% of 37.09s total
      flat  flat%   sum%        cum   cum%
    37.09s   100%   100%     37.09s   100%  sync.(*Mutex).Unlock
         0     0%   100%     37.09s   100%  52lu/go-pprof/scenes.UseMutexDemo.func1
1
2
3
4
5
2
3
4
5
由上面可以看出,锁争用集中在互斥锁中,互斥带来的休眠时间为37.09s
# 6.3 查看具体代码
# 查看具体函数
(pprof) list UseMutexDemo
Total: 37.09s
ROUTINE ======================== 52lu/go-pprof/scenes.UseMutexDemo.func1 in /Users/liuqh/ProjectItem/GoItem/go-pprof/scenes/mutex.go
         0     37.09s (flat, cum)   100% of Total
         .          .     21:   stu.idList = append(stu.idList, id)
         .          .     22:   time.Sleep(time.Millisecond * 200)
         .          .     23:  }()
         .          .     24: }
         .          .     25:}
1
2
3
4
5
6
7
8
9
10
2
3
4
5
6
7
8
9
10
# 6.4 在浏览器中查看
(pprof) web
1
# 7. 排查阻塞操作
在程序中,除了锁的争用会导致阻塞之外,很多逻辑都会导致阻塞,比如网络请求超时、IO阻塞等。**需要注意的是:默认不开启阻塞分析,需要调用runtime.SetMutexProfileFraction进行设置。**开启方式如下:
func init() {
 ...
 // 开启block分析
 runtime.SetBlockProfileRate(1)
}
1
2
3
4
5
2
3
4
5
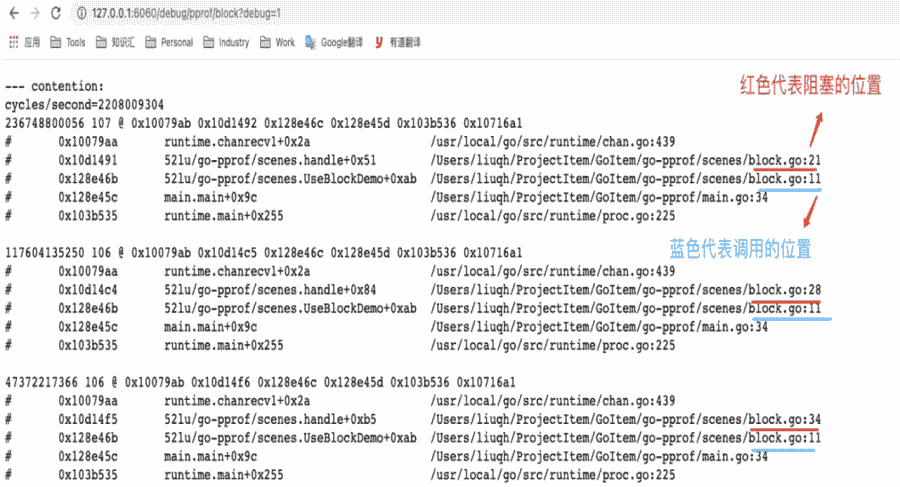
# 7.1 查看/debug/pprof
# 1. 当前阻塞数量
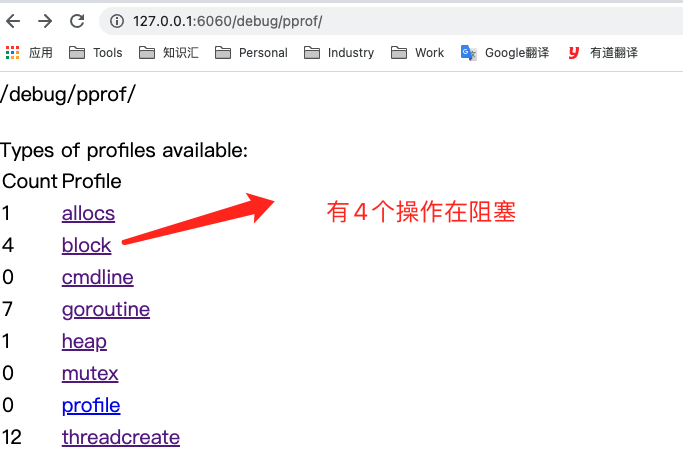
# 2. 具体阻塞位置
# 7.2 进入交互式
➜ go tool pprof http://127.0.0.1:6060/debug/pprof/block
Fetching profile over HTTP from http://127.0.0.1:6060/debug/pprof/block
Saved profile in /Users/liuqh/pprof/pprof.contentions.delay.012.pb.gz
Type: delay
Time: Nov 17, 2021 at 4:30pm (CST)
Entering interactive mode (type "help" for commands, "o" for options)
1
2
3
4
5
6
2
3
4
5
6
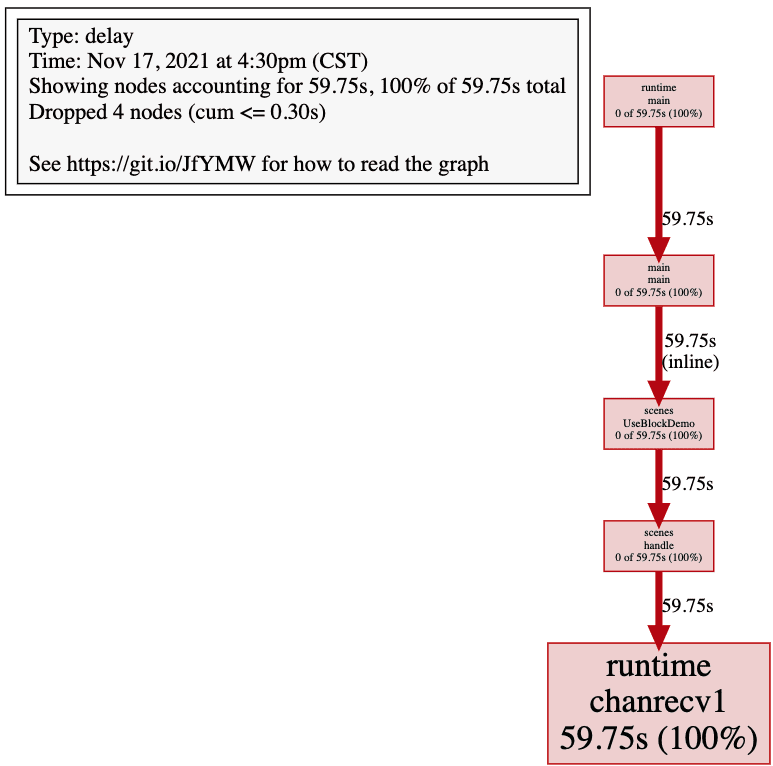
# 7.3 排序阻塞时间
(pprof) top
Showing nodes accounting for 59.75s, 100% of 59.75s total
Dropped 4 nodes (cum <= 0.30s)
      flat  flat%   sum%        cum   cum%
    59.75s   100%   100%     59.75s   100%  runtime.chanrecv1
         0     0%   100%     59.75s   100%  52lu/go-pprof/scenes.UseBlockDemo (inline)
         0     0%   100%     59.75s   100%  52lu/go-pprof/scenes.handle
         0     0%   100%     59.75s   100%  main.main
         0     0%   100%     59.75s   100%  runtime.main
1
2
3
4
5
6
7
8
9
2
3
4
5
6
7
8
9
runtime.chanrecv1: 代表通道chan读取时,阻塞。
# 7.4 查看具体阻塞代码
# 查看UseBlockDemo函数,发现内部调用函数handle,且handle函数耗时59.75s
(pprof) list Use
Total: 59.75s
ROUTINE ======================== 52lu/go-pprof/scenes.UseBlockDemo in /Users/liuqh/ProjectItem/GoItem/go-pprof/scenes/block.go
         0     59.75s (flat, cum)   100% of Total
         .          .      6:var sqlCh = make(chan []string)
         .          .      7:var bCh = make(chan bool)
         .          .      8:
         .          .      9:func UseBlockDemo() {
         .          .     10: for i := 0; i < 1000; i++ {
         .     59.75s     11:  handle()
         .          .     12: }
         .          .     13:}
         .          .     14:
         .          .     15:func handle()  {
         .          .     16: // 等待文件写入
# 查看handle
(pprof) list handle
Total: 59.75s
ROUTINE ======================== 52lu/go-pprof/scenes.handle in /Users/liuqh/ProjectItem/GoItem/go-pprof/scenes/block.go
         0     59.75s (flat, cum)   100% of Total
         .          .     16: // 等待文件写入
         .          .     17: go func() {
         .          .     18:  time.Sleep(time.Second)
         .          .     19:  bCh <- true
         .          .     20: }()
         .     35.08s     21: <-bCh
         .          .     22: // 发起网络请求
         .          .     23: go func() {
         .          .     24:  time.Sleep(time.Millisecond * 500)
         .          .     25:  reqCh <- "req success"
         .          .     26: }()
         .          .     27: // 阻塞等待
         .     17.59s     28: <-reqCh
         .          .     29: // 执行SQL查询
         .          .     30: go func() {
         .          .     31:  time.Sleep(time.Millisecond * 200)
         .          .     32:  sqlCh <- []string{"hello","world"}
         .          .     33: }()
         .      7.08s     34: <-sqlCh
         .          .     35:}
         .          .     36:
1
2
3
4
5
6
7
8
9
10
11
12
13
14
15
16
17
18
19
20
21
22
23
24
25
26
27
28
29
30
31
32
33
34
35
36
37
38
39
40
41
42
2
3
4
5
6
7
8
9
10
11
12
13
14
15
16
17
18
19
20
21
22
23
24
25
26
27
28
29
30
31
32
33
34
35
36
37
38
39
40
41
42
# 7.5 在浏览器中查看